The Graphinator
Description: Adding css graph to html table
Publish Date: 12/19/2013
Keywords: javascript javascript table scrape html table into chart typescript
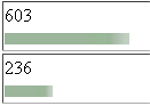
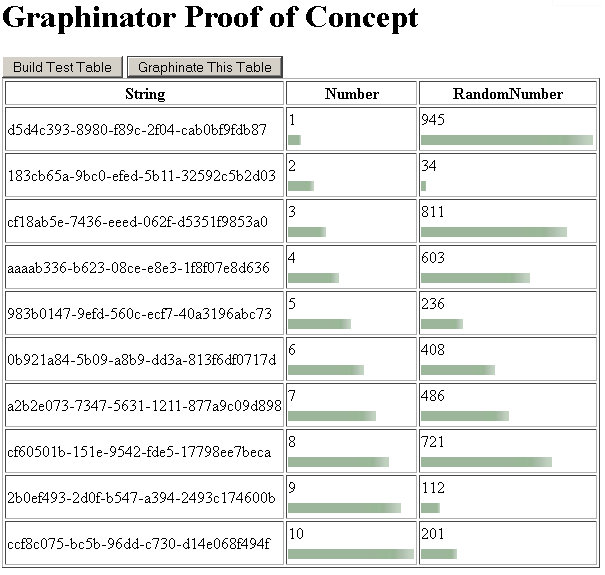
I was playing around with scraping an html table for number values, converting them to 100 based per column, then use a simple css width percentage to add a horizontal bar graph to each cell.
Mileage will vary but maybe I'll get around to perfecting it as a plugin that is robust enough. Of course this was written in typescript :).
Working version
http://jsfiddle.net/TheDev6/62ZXS/
What it looks like..
Comments: 0
© Chadwick 2021